• Home
  • Games
    Action-adventure Simulation Business Role Playing Sports Competition Casual Intelligence Card Strategy Music Rhythm Text Puzzle
  • Apps
    Business Office Newsletter Social Life Entertainment Online Shopping Practical Tools Travel Educational Learning Information Reading Sports and Health
  • Articles

English 中文(简体) 中文(繁体) 한국어 日本語 Português Español Русский العربية Indonesia Deutsch Français ภาษาไทย
Home Apps Educational Learning CSV Graph Tool
CSV Graph Tool

CSV Graph Tool

1
2
3
4
5
Download
  • Version 3.3
  • Category Educational Learning
  • Package Name com.valeonom.csvgrapher
  • Update Time September 12, 2025
  • Size 4.59MB
About this app

Plot CSV files, any column VS any other column.

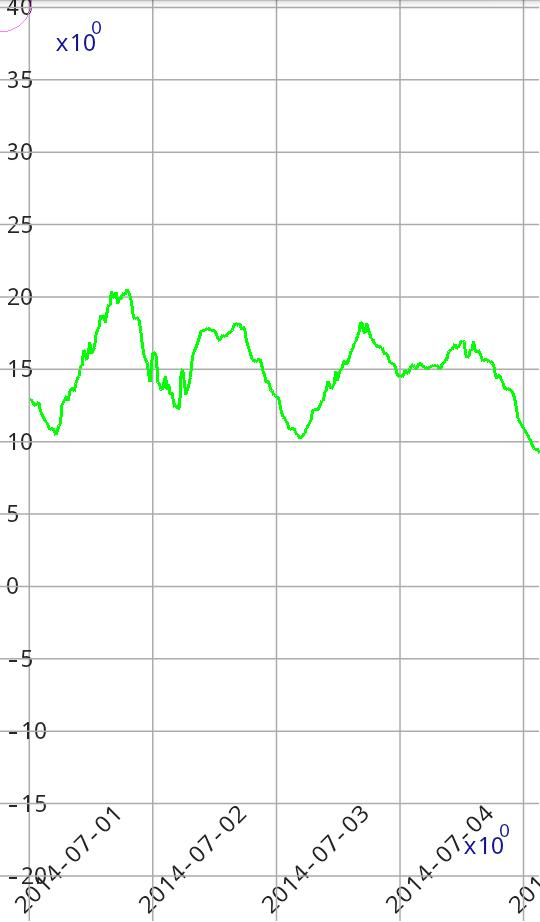
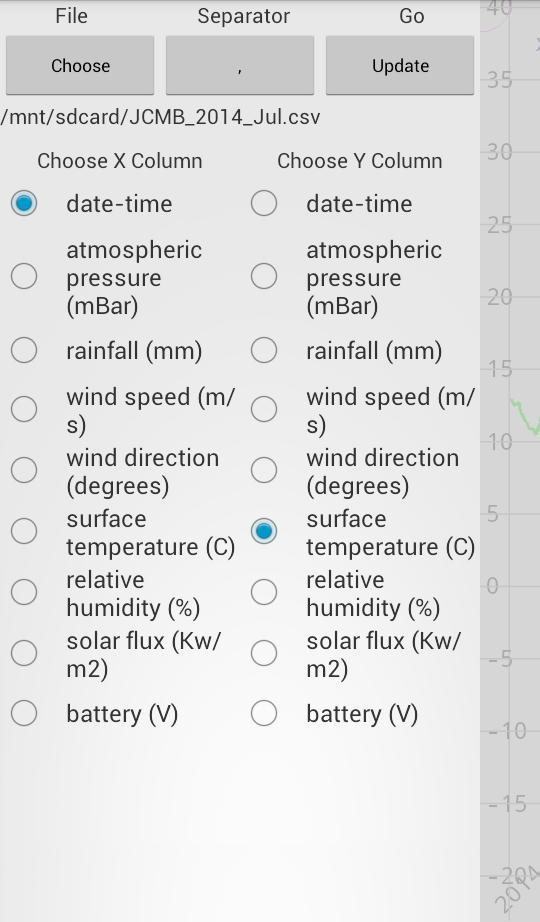
Graph 2 columns in a CSV file. You can pick 2 columns, one for x, and the other for y to graph.

Consider Installing a file browser on your device. This app will let you pick CSV files directly from the file browser from within CSV Grapher, and via touching a CSV file from your file browser of choice via open with dialog.

- Supports multiple data delimiter (TAB, semicolon, space, and etc...).

- Data is auto sorted based on the X chosen column before plotting

- format auto detected to be either number or date

- Pan and zoom/scale X & Y independently. .

- Very optimized for speed. Browse more than 10K data points smoothly.

If your csv file doesn't work, just email a sample representative of your file and I'll see what I can do to get it working.

If you would like a very custom application. Contact me for custom solutions.

Time Formats

The best date time format to use is the following

yyyy-MM-dd HH:mm:ss Z example: 2017-12-31 23:59:59 -0800

yyyy-MM-dd HH:mm:ss example: 2017-12-31 23:59:59

yyyy-MM-dd HH:mm example: 2017-12-31 23:59

yyyy-MM-dd example: 2017-12-31

There are others that are supported. If you are generating the CSV file and want best support/performance use one of the above as it minimizes ambiguity.

By default the timezone GMT is assumed if not specified. Furthermore the displayed timezone in the graph is GMT. Which means is if your timezones that are specified are not GMT (e.g. your local time) then the graph vertical lines for the days will be when the day changes if it were GMT.

What's New in the Latest Version 3.3

Last updated on Aug 8, 2016 * Now you can graph by row #
Download(4.59MB)
Users also viewed
  • Hyakunin Isshu - Wasuramoti

    Hyakunin Isshu - Wasuramoti

    2.1.4 January 22, 2026
  • 3PAR Quick Specs

    3PAR Quick Specs

    1.0 January 22, 2026
  • Rahasia Sukses Bahasa Inggris

    Rahasia Sukses Bahasa Inggris

    1.0 January 22, 2026
  • Shree Ambica

    Shree Ambica

    1.8 January 22, 2026
  • G.E.C. Bharuch

    G.E.C. Bharuch

    1.2 January 21, 2026
  • Jira

    Jira

    157.1.9 January 21, 2026
  • Rohani Ilag in Hindi

    Rohani Ilag in Hindi

    2.2 January 20, 2026
  • MobiLock

    MobiLock

    2.3.1 January 20, 2026
  • Japanese-Indonesia Dictionary

    Japanese-Indonesia Dictionary

    0.2.5 January 20, 2026
  • English Nursery Rhymes - 01

    English Nursery Rhymes - 01

    2.2 January 20, 2026
  • English Flashcards For Kids

    English Flashcards For Kids

    4.0 January 19, 2026
  • ESHRE 2014

    ESHRE 2014

    1.0.3 January 19, 2026
  • R+F

    R+F

    20.7 January 18, 2026
  • Lyrebird: Learn HINDI

    Lyrebird: Learn HINDI

    13.6 January 18, 2026
  • EZeye IPC

    EZeye IPC

    1.8 January 18, 2026
About Privacy Policy Terms of Service Cooking Policy

© Copyright 2017-2026 downde.com